更新时间:2023-01-12 16:15:09浏览次数:320+次
本文介绍如何在Linux系统上安装和配置Apache Skywalking APM工具的方法。
安装和配置Apache Skywalking APM
步骤1、设置先决条件
本文的前提条件:
安装了JDK 1.8.0或更高版本的Linux服务器。
用到Elasticsearch,另外,尽管创建了Elasticsearch集群,但可以使用任何其他存储,如H2、OpenSearch、MySQL、TiDB、InfluxDB、PostgreSQL。相关参考在Ubuntu 22.04系统上安装Elasticsearch的方法,地址在https://www.hmxthome.com/linux/4911.html。
Elasticsearch弹性搜索启动后,验证其是否正常工作:
$ curl -X GET localhost:9200
{
"name" : "localhost.localdomain",
"cluster_name" : "my-application",
"cluster_uuid" : "cIYbRiEwTMyVOpYuyn4dnw",
"version" : {
"number" : "8.4.3",
"build_flavor" : "default",
"build_type" : "rpm",
"build_hash" : "42f05b9372a9a4a470db3b52817899b99a76ee73",
"build_date" : "2023-01-11T07:17:24.662462378Z",
"build_snapshot" : false,
"lucene_version" : "9.3.0",
"minimum_wire_compatibility_version" : "7.17.0",
"minimum_index_compatibility_version" : "7.0.0"
},
"tagline" : "You Know, for Search"
}
还要确保已安装JDK:
##在Debian/Ubuntu上
sudo apt install default-jdk -y
##在RHEL/Rocky_Linux/Alma/CentOS上
sudo dnf install java-11-openjdk-devel -y
验证安装:
$ java --version
openjdk 11.0.16
步骤2、安装和配置Apache Skywalking APM
您可以从官方的Apache Skywalking下载页面下载Apache Skywalking,地址在https://archive.apache.org/dist/skywalking。
您还可以下载如下所示的最新版本。首先,导出最新版本:
VER=$(curl -s https://api.github.com/repos/apache/skywalking/releases/latest|grep tag_name|cut -d '"' -f 4|sed 's/v//')
然后使用以下命令下载版本:
wget https://archive.apache.org/dist/skywalking/$VER/apache-skywalking-apm-$VER.tar.gz
下载后,提取文件:
tar -xvf apache-skywalking-apm-*.tar.gz
将文件移动到/opt目录:
sudo mv apache-skywalking-apm-bin /opt/apache-skywalking-apm-bin
设置正确的权限:
sudo chmod -R 775 /opt/apache-skywalking-apm-bin
导航到目录:
cd /opt/apache-skywalking-apm-bin
进入目录后,需要进行一些配置:
sudo vim config/application.yml
在文件中,找到存储并将其从H2设置为弹性搜索,如下所示:
storage:
selector: ${SW_STORAGE:elasticsearch}
elasticsearch:
namespace: ${SW_NAMESPACE:"my-application"}
clusterNodes: ${SW_STORAGE_ES_CLUSTER_NODES:localhost:9200}
protocol: ${SW_STORAGE_ES_HTTP_PROTOCOL:"http"}
connectTimeout: ${SW_STORAGE_ES_CONNECT_TIMEOUT:3000}
socketTimeout: ${SW_STORAGE_ES_SOCKET_TIMEOUT:30000}
responseTimeout: ${SW_STORAGE_ES_RESPONSE_TIMEOUT:15000}
numHttpClientThread: ${SW_STORAGE_ES_NUM_HTTP_CLIENT_THREAD:0}
user: ${SW_ES_USER:"elastic"}
password: ${SW_ES_PASSWORD:"changeme"}
# trustStorePath: ${SW_STORAGE_ES_SSL_JKS_PATH:""}
# trustStorePass: ${SW_STORAGE_ES_SSL_JKS_PASS:""}
# secretsManagementFile: ${SW_ES_SECRETS_MANAGEMENT_FILE:""}
# Secrets management file in the properties format includes the username, password, which are managed by 3rd party tool.
在上述文件中,我们将存储形式H2更改为弹性搜索,因为H2不支持持久数据存储。上述参数描述如下:
selector:存储选择器。对于本例,将值设置为弹性搜索。
nameSpace:表示Elasticsearch集群中所有索引名称的前缀。
clusterNodes:Elasticsearch集群的端点。
user:用于访问Elasticsearch集群的用户名。默认用户名是弹性的。
password:用于访问Elasticsearch集群的密码。通常在创建Elasticsearch集群时指定。默认设置为changeme。
在配置中,您可以选择更改SkyWalking用于与Elasticsearch通信的默认端口(12800用于RESTful API操作,11800用于gRPC API操作):
core:
selector: ${SW_CORE:default}
default:
# Mixed: Receive agent data, Level 1 aggregate, Level 2 aggregate
# Receiver: Receive agent data, Level 1 aggregate
# Aggregator: Level 2 aggregate
role: ${SW_CORE_ROLE:Mixed} # Mixed/Receiver/Aggregator
restHost: ${SW_CORE_REST_HOST:0.0.0.0}
restPort: ${SW_CORE_REST_PORT:12800}
restContextPath: ${SW_CORE_REST_CONTEXT_PATH:/}
gRPCHost: ${SW_CORE_GRPC_HOST:0.0.0.0}
gRPCPort: ${SW_CORE_GRPC_PORT:11800}
您还可以在webapp文件夹中进行配置:
sudo vim webapp/webapp.yml
对于本文,我们将使用默认值,但您仍然可以根据业务需求修改这些值:
server:
port: 8080
spring:
cloud:
gateway:
routes:
- id: oap-route
uri: lb://oap-service
predicates:
- Path=/graphql/**
discovery:
client:
simple:
instances:
oap-service:
- uri: http://127.0.0.1:12800
# - uri: http://<oap-host-1>:<oap-port1>
# - uri: http://<oap-host-2>:<oap-port2>
mvc:
throw-exception-if-no-handler-found: true
web:
resources:
add-mappings: true
management:
server:
base-path: /manage
步骤3、为Apache Skywalking创建systemd单元
我们需要创建一个用于停止和启动应用程序的systemd服务。创建文件,如下所示:
sudo vim /etc/systemd/system/skywalking.service
在文件中,添加以下行:
[Unit]
Description=Apache Skywalking
After=network.target
[Service]
Type=oneshot
User=root
WorkingDirectory=/opt/apache-skywalking-apm-bin/
ExecStart=/bin/bash /opt/apache-skywalking-apm-bin/bin/startup.sh
RemainAfterExit=yes
RestartSec=5
[Install]
WantedBy=multi-user.target
保存文件并重新加载系统守护程序:
sudo systemctl daemon-reload
对于基于Rhel的系统,如下所示配置SELinux:
sudo /sbin/restorecon -v /opt/apache-skywalking-apm-bin/bin/startup.sh
启动并启用服务:
sudo systemctl enable --now skywalking
验证服务是否正在运行:
$ systemctl status skywalking
允许服务通过防火墙:
##对于UFW
sudo ufw allow 8080
##用于Firewalld
sudo firewall-cmd --add-port=8080/tcp --permanent
sudo firewall-cmd --reload
步骤4、访问Apache Skywalking WebUI
此时,您可以使用URL访问Apache Skywalking WebUI,地址格式是http://IP_Address:8080,如下图所法示:
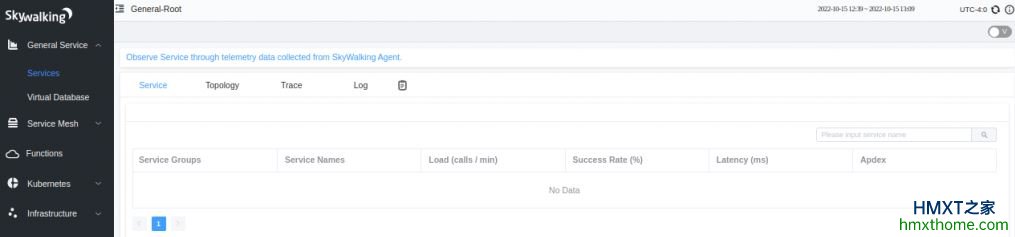
此时,我们无法查看任何指标,因为我们没有执行任何配置。在本文中,我将演示如何从Linux主机/代理收集和导出度量。
步骤5、安装Prometheus节点导出器
现在我们需要设置一个代理,以便能够查看度量。在这里,我们将使用Prometheus节点导出器从代理获取日志。
首先,下载最新的存档:
##For AMD64
VERSION=$(curl -s https://api.github.com/repos/prometheus/node_exporter/releases/latest|grep tag_name|cut -d '"' -f 4|sed 's/v//')
wget https://github.com/prometheus/node_exporter/releases/download/v$VERSION/node_exporter-$VERSION.linux-amd64.tar.gz
##For ARM64
VERSION=$(curl -s https://api.github.com/repos/prometheus/node_exporter/releases/latest|grep tag_name|cut -d '"' -f 4|sed 's/v//')
wget https://github.com/prometheus/node_exporter/releases/download/v$VERSION/node_exporter-$VERSION.linux-arm64.tar.gz
##For i386
VERSION=$(curl -s https://api.github.com/repos/prometheus/node_exporter/releases/latest|grep tag_name|cut -d '"' -f 4|sed 's/v//')
wget https://github.com/prometheus/node_exporter/releases/download/v$VERSION/node_exporter-$VERSION.linux-386.tar.gz
现在提取存档:
tar -xf node_exporter-$VERSION.linux-*.tar.gz
将文件移动到/opt目录:
sudo mv node_exporter-*/node_exporter /usr/local/bin
为服务创建专用用户:
sudo adduser -M -r -s /sbin/nologin prometheus
创建systemd服务文件:
$ sudo vim /etc/systemd/system/node_exporter.service
[Unit]
Description=Node Exporter
After=network.target
[Service]
User=prometheus
Group=prometheus
Type=simple
ExecStart=/usr/local/bin/node_exporter
ExecReload=/bin/kill -HUP $MAINPID
Restart=on-failure
RestartSec=5s
[Install]
WantedBy=multi-user.target
保存文件并重新加载守护程序:
sudo systemctl daemon-reload
在基于Rhel的系统上,配置SELinux:
sudo /sbin/restorecon -v /usr/local/bin/node_exporter
启动并启用服务:
sudo systemctl enable --now node_exporter
验证服务是否正在运行:
$ systemctl status node_exporter
检查节点导出器端口:
$ sudo ss -aplnt | grep node
LISTEN 0 128 *:9100 *:* users:(("node_exporter",pid=353801,fd=3))
允许此端口通过防火墙:
##对于UFW
sudo ufw allow 9100
##用于Firewalld
sudo firewall-cmd --add-port=9100/tcp --permanent
sudo firewall-cmd --reload
步骤6、安装和配置OpenTelemetry Collector
OpenTelemetry收集器是在2019年5月融合OpenCensus和OpenTracing后形成的。其主要目标是提供一组标准化的供应商无关SDK、API和工具,用于接收、转换数据并将数据发送到Observability后端。
该工具可以安装在Linux系统上,如下所示:
##On Debian/Ubuntu
sudo apt update && sudo apt install wget curl -y
VERSION=$(curl -s https://api.github.com/repos/open-telemetry/opentelemetry-collector-releases/releases/latest|grep tag_name|cut -d '"' -f 4|sed 's/v//')
wget https://github.com/open-telemetry/opentelemetry-collector-releases/releases/download/v${VERSION}/otelcol_${VERSION}_linux_amd64.deb
sudo dpkg -i otelcol_${VERSION}_linux_amd64.deb
##On Rhel/Rocky/Alma/CentOS
sudo yum -y install wget curl
VERSION=$(curl -s https://api.github.com/repos/open-telemetry/opentelemetry-collector-releases/releases/latest|grep tag_name|cut -d '"' -f 4|sed 's/v//')
wget https://github.com/open-telemetry/opentelemetry-collector-releases/releases/download/v${VERSION}/otelcol_${VERSION}_linux_amd64.rpm
sudo rpm -Uvh otelcol_${VERSION}_linux_amd64.rpm
安装后,您需要将其配置为从Prometheus节点导出器向Apache Skywalking后端导出度量。
将可用配置移动到备份文件:
sudo mv /etc/otelcol/config.yaml /etc/otelcol/config.yaml.bak
现在创建一个新的配置:
sudo vim /etc/otelcol/config.yaml
添加以下行并在需要时进行替换:
receivers:
prometheus:
config:
scrape_configs:
- job_name: "vm-monitoring" # make sure to use this in the vm.yaml to filter only VM metrics
scrape_interval: 10s
static_configs:
- targets: ["192.168.205.11:9100"]
processors:
batch:
exporters:
########################################
# If you want to use otlp exporter please ensure that your OAP version is >= 9.2.0 #
# or you can use oc exporter, The config format should be: #
# opencensus: #
# endpoint: "127.0.0.1:11800" #
# tls: #
# insecure: true #
########################################
otlp:
endpoint: "127.0.0.1:11800" # The OAP Server address
########################################
# OTEL previous version before 0.34.0 the config format, eg. 0.29.0 should be:#
# insecure: true #
# The new version should be: #
# tls: #
# insecure: true #
########################################
tls:
insecure: true
#insecure: true
# Exports data to the console
logging:
logLevel: debug
service:
pipelines:
metrics:
receivers: [prometheus]
processors: [batch]
#########################################
# oc exporter config format: #
# exporters: [opencensus,logging] #
#########################################
exporters: [otlp, logging]
记住用运行节点导出器的IP地址替换192.168.205.11,然后保存文件并重新启动服务:
sudo systemctl restart otelcol
验证服务是否正在运行:
$ systemctl status otelcol
接下来配置OpenTelemetry接收器。
要配置OpenTelemetry接收器,请编辑Apache Skywalking配置文件:
sudo vim /opt/apache-skywalking-apm-bin/config/application.yml
在文件中,确保在enabledOtelRules下捕获VM,以便能够从Linux主机收集度量:
eceiver-otel:
selector: ${SW_OTEL_RECEIVER:default}
default:
enabledHandlers: ${SW_OTEL_RECEIVER_ENABLED_HANDLERS:"oc,otlp"}
enabledOtelRules: ${SW_OTEL_RECEIVER_ENABLED_OTEL_RULES:"istio-controlplane,k8s-node,oap,vm,mysql,postgresql"}
通常,在config/otel-rules/路径中定义了各种enabledOtelRules:
$ ls config/otel-rules/
istio-controlplane.yaml k8s-cluster.yaml k8s-instance.yaml k8s-node.yaml k8s-service.yaml mysql.yaml oap.yaml postgresql.yaml vm.yaml
在本例中,我们将使用vm.yaml,它定义了用于从Linux主机收集度量的若干规则。
如果进行了任何更改,请重新启动服务:
sudo systemctl restart skywalking
步骤7、使用Apache Skywalking查看度量
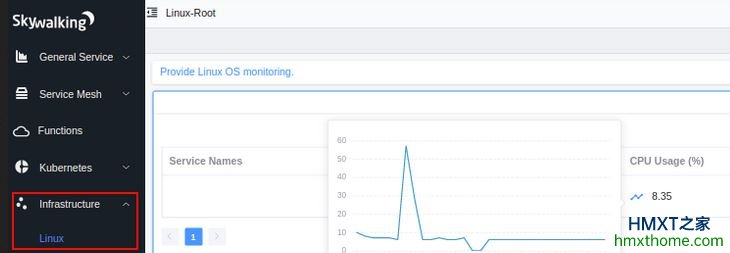
现在,您可以通过导航到Infrastructure>Linux来查看使用Prometheus Node Exporter收集的指标:
您可以在仪表板>仪表板列表下加载图形:
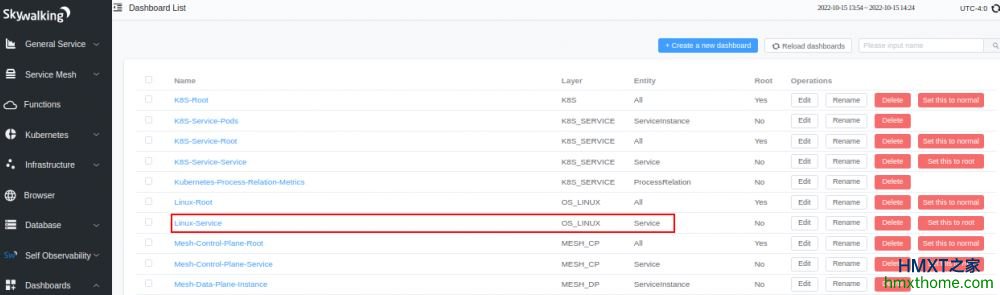
从列表中,标识OS_LINUX的仪表板,并如图所示加载它:

至此,安装和配置Apache Skywalking APM工具完成。使用这里获得的知识,您可以轻松地为微服务、云原生和基于容器的环境配置监控。
相关资讯