更新时间:2023-04-20 08:54:36浏览次数:814+次
本文介绍在Ubuntu系统上安装、配置和使用VictoriaMetrics时间序列数据库的方法。VictoriaMetrics是一个开源、高性能、经济高效的时间序列数据库和监控解决方案,它旨在处理应用程序、服务和设备生成的大量时间序列数据,并实现对这些数据的高效查询和分析,它快速且可扩展,能够每秒处理数百万个数据点,并能够在多个节点或集群之间水平扩展,它使用了一种面向列的存储格式,可以优化时间序列数据的压缩和检索。
在Ubuntu上安装、配置和使用VictoriaMetrics时间序列数据库的详细步骤
步骤1:安装VictoriaMetrics时间序列数据库
VictoriaMetrics可以通过多种方式进行安装。其中包括:
二进制文件。
VictoriaMetrics的单节点和集群版本的Helm charts。
Docker Image。
VictoriaMetrics的Kubernetes运算符。
安装集群VictoriaMetrics的可靠角色(由Victoria Metrics提供)。
安装集群VictoriaMetrics的可靠角色(由社区提供)。
安装单节点VictoriaMetrics的可靠角色(由社区提供)。
适用于VictoriaMetrics的Snap软件包。
对于本指南,为了更容易,我们将使用Snap在Ubuntu系统上安装VictoriaMetrics。首先,您需要确保snapd已安装并在Ubuntu系统上运行。
安装并运行Snap后,您可以轻松安装VictoriaMetrics。检查可用的软件包信息:
$ snap info victoriametrics
summary: VictoriaMetrics is fast, cost-effective and scalable time-series
database.
publisher: VictoriaMetrics
store-url: https://snapcraft.io/victoriametrics
contact: info@victoriametrics.com
license: Apache-2.0
description: |
* VictoriaMetrics can be used as long-term storage for Prometheus or for
channels:
latest/stable: v1.89.1 2023-03-14 (220) 9MB -
latest/candidate: v1.89.1 2023-03-14 (220) 9MB -
latest/beta: v1.89.1 2023-03-14 (220) 9MB -
latest/edge: v1.89.1 2023-03-14 (220) 9MB -
使用以下命令安装VictoriaMetrics:
$ sudo snap install victoriametrics
2023-04-18T18:34:25Z INFO Waiting for automatic snapd restart...
victoriametrics v1.90.0 from VictoriaMetrics installed
完成后,通过以下命令检查8428端口上的运行状况来验证安装:
$ curl http://localhost:8428/metrics
flag{name="snapshotAuthKey", value="secret", is_set="false"} 1
flag{name="snapshotCreateTimeout", value="0s", is_set="false"} 1
flag{name="snapshotsMaxAge", value="0", is_set="false"} 1
flag{name="sortLabels", value="false", is_set="false"} 1
flag{name="storage.cacheSizeIndexDBDataBlocks", value="0", is_set="false"} 1
flag{name="storage.cacheSizeIndexDBIndexBlocks", value="0", is_set="false"} 1
flag{name="storage.cacheSizeIndexDBTagFilters", value="0", is_set="false"} 1
flag{name="storage.cacheSizeStorageTSID", value="0", is_set="false"} 1
flag{name="storage.maxDailySeries", value="0", is_set="false"} 1
flag{name="storage.maxHourlySeries", value="0", is_set="false"} 1
flag{name="storage.minFreeDiskSpaceBytes", value="10000000", is_set="false"} 1
flag{name="storageDataPath", value="/var/lib/victoriametrics", is_set="true"} 1
flag{name="streamAggr.config", value="", is_set="false"} 1
flag{name="streamAggr.dedupInterval", value="0s", is_set="false"} 1
flag{name="streamAggr.keepInput", value="false", is_set="false"} 1
flag{name="tls", value="false", is_set="false"} 1
flag{name="tlsCertFile", value="", is_set="false"} 1
flag{name="tlsCipherSuites", value="", is_set="false"} 1
flag{name="tlsKeyFile", value="secret", is_set="false"} 1
flag{name="tlsMinVersion", value="", is_set="false"} 1
flag{name="usePromCompatibleNaming", value="false", is_set="false"} 1
flag{name="version", value="false", is_set="false"} 1
flag{name="vmalert.proxyURL", value="", is_set="false"} 1
flag{name="vmui.customDashboardsPath", value="", is_set="false"} 1
现在有了这个输出,说明我们已经安装并运行了VictoriaMetrics。
步骤2:配置VictoriaMetrics时间序列数据库
使用以上方法安装后,您可以对VictoriaMetrics时间序列数据库进行所需的配置。VictoriaMetric允许在命令行中使用%{ENV_VAR}语法的变量。
但对于Snap安装,我们可以使用以下命令设置:
echo 'FLAGS="-selfScrapeInterval=10s -search.logSlowQueryDuration=20s"' | sudo tee $SNAP_DATA/var/snap/victoriametrics/current/extra_flags
这将把Flags添加到/var/snap/victoriametrics/current/extra_flags文件中。在这里,我们不会更改-storageDataPath标志,因为snap包对主机文件系统的访问权限有限。数据文件夹位于/var/snap/victoriametrics/current/var/lib/victoriametrics。
要使所做的更改生效,请重新启动服务:
$ sudo snap restart victoriametrics
Restarted.
您也可以通过编辑以下文件来更改crape配置:
sudo vim /var/snap/victoriametrics/current/etc/victoriametrics-scrape-config.yaml
一旦进行了所需的更改,您可以使用以下命令重新读取配置:
curl 127.0.0.1:8428/-/reload
步骤3:需要Prometheus来使用VictoriaMetrics
Prometheus是一个免费的开源事件监控和警报工具。它通过收集和存储作为时间序列数据的指标来工作。为了证明VictoriaMetrics数据库是否运行良好,我们将从Prometheus向其发送一些指标,前提是Ubuntu系统中要有Prometheus。
一旦Prometheus安装并运行,我们将对配置文件进行调整:
sudo vim /etc/prometheus/prometheus.yml
要允许Prometheus向VictoriaMetrics发送数据,请添加以下行:
remote_write:
- url: http://127.0.0.1:8428/api/v1/write
如果VictoriaMetrics服务器在单独的主机上运行,则需要将127.0.0.0.1替换为该服务器的IP地址。
要应用配置,请使用以下命令:
sudo kill -HUP `pidof prometheus`
sudo systemctl restart prometheus.service
现在,Prometheus将把传入的数据写入本地存储,并行复制到远程存储。这意味着,即使远程存储不可用,数据也将在设置的–storage.tsdb.retention.time持续时间内保持在本地存储中可用。
如果您要从多个Prometheus实例向VictoriaMetrics发送数据,则需要在全局部分下添加以下行:
global:
external_labels:
datacenter: dc-123
这将告诉Prometheus在将每个样本发送到远程存储之前,为其添加datacenter=dc-123标签。标签数据中心就是一个例子,您需要将其设置为Prometheus实例中的唯一变量。
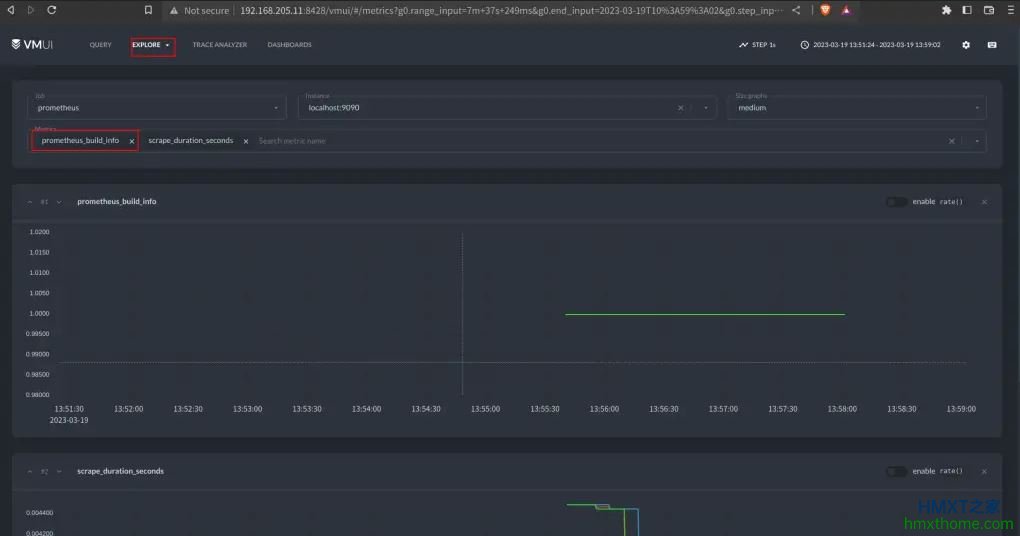
现在加载VictoriaMetrics VMUI,查看是否已收到Prometheus度量。要实现这一点,请使用URL,地址格式为http://IP_Address:8428。
加载VMUI页面后,执行查询以验证是否存储了Prometheus数据。例如:
scrape_samples_scraped
您还可以探索其他Prometheus指标,如下所示:
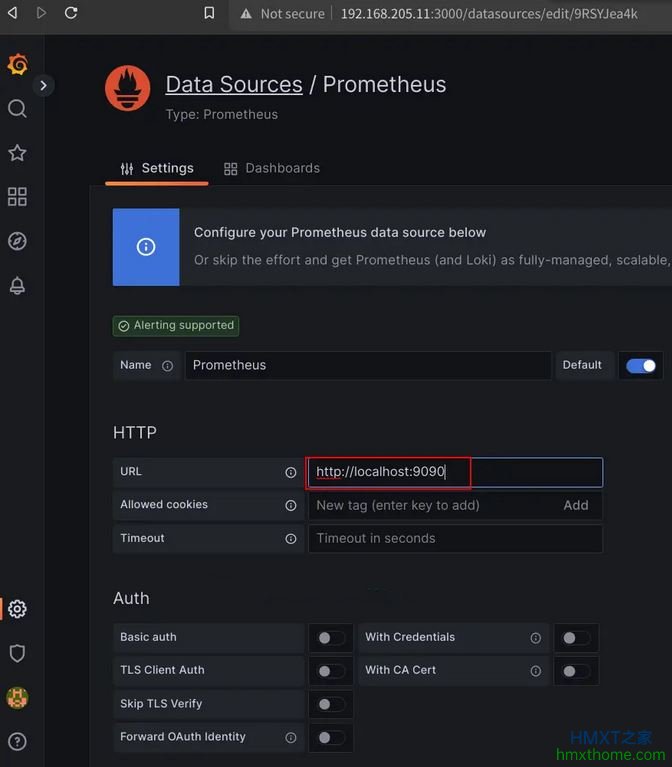
步骤4:需要Grafana来使用VictoriaMetrics
Grafan可用于可视化仪表板,在安装Grafana后,使用URL访问它,地址格式为http://IP_Address:3000,登录后,将Prometheus添加为您的数据源:
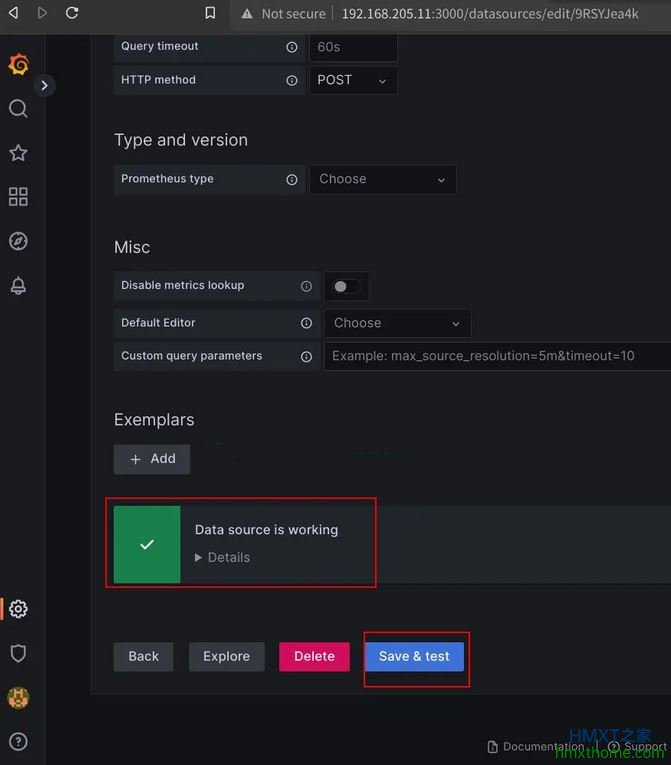
如果一切正常,你应该看看这个:
现在,对添加的Prometheus数据源运行查询,并查看图形输出。出于测试目的,我们将执行与在VictoriaMetrics VMUI中执行的命令类似的命令:
scrape_samples_scraped
一旦运行了查询,您应该会看到以下输出:
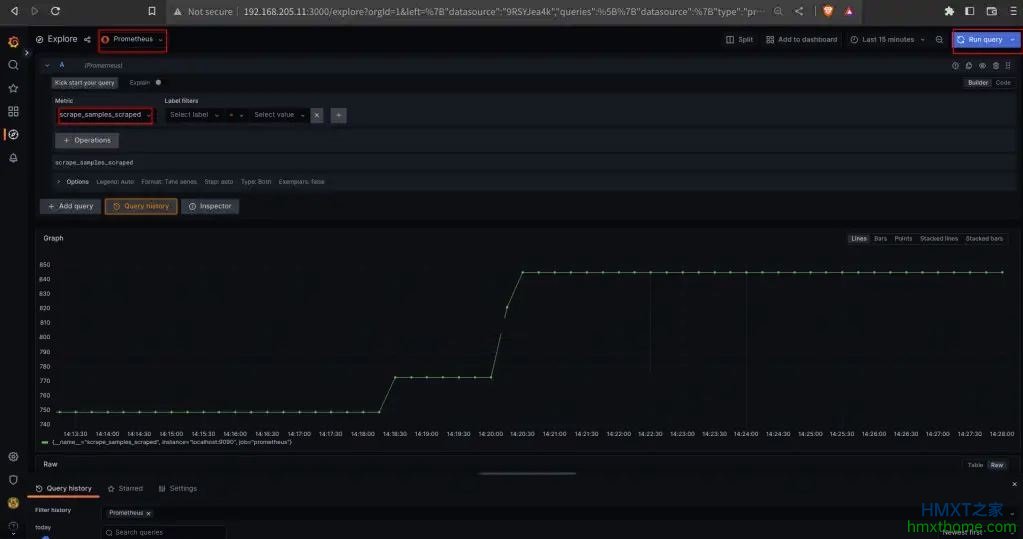
从上面的输出中,我们可以看到VictoriaMetrics的工作非常完美。这说明,使用VictoriaMetrics时间序列数据库的方式并不复杂,很容易就上手了。
相关资讯